In the most recent Crosscut/Elway Poll, we took a closer look at this perceived split, seeking out similarities and differences across the state by type of community, as well as traditional geographic regions.
We polled 400 voters throughout the state and asked a series of questions about their community and its outlook for the future. Respondents came from a range of communities — 17% large city, 28% small city, 24% suburb, 18% small town and 13% rural — and their responses did vary based on those distinctions.
In general, optimism went up with population density. Scores on the Voter Outlook Index — which measures respondents’ attitudes about the future of their households, communities, state and nation — were highest in large cities and lowest in rural areas. Majorities in every community type, except rural areas, said things were looking up in their community. In rural areas, a 48% plurality said things were looking worse for the year ahead, including 1 in 5 (20%) who said their community’s future looked “much worse.”
We also asked whether “your community is making progress or losing ground” on a series of eight topics. The table below displays the answers by community type. The green cells are those where people who said their community is "making progress" outnumbered those who said it is "losing ground." The red cells are the opposite.
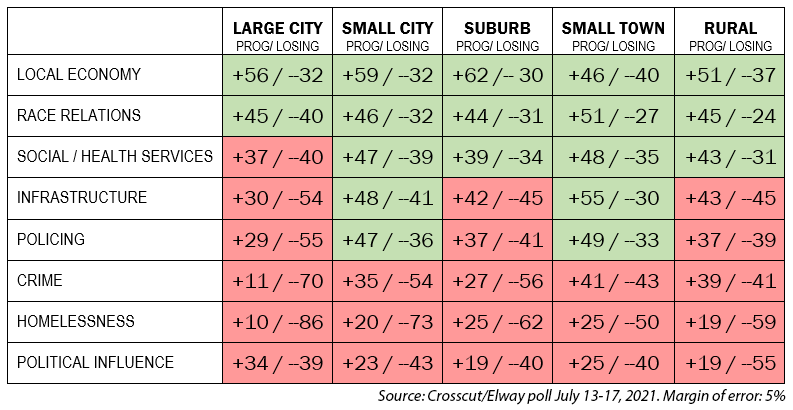
Each type of community was seen as making progress on the economy and race relations. On the other hand, sizable majorities in communities of all types thought they were losing ground on crime and homelessness. Performance on social and health services, infrastructure and policing varied by community size.
Despite the general optimism expressed in the Voter Outlook Index, voters in large cities were the most critical of how their city was handling these issues. More large city voters said they were losing ground than making progress on six of the eight issues listed.
Voters in small cities and towns were the most positive, with more saying they were gaining ground on five of the eight categories.
Other than the economy, there was no majority in any type of community who thought they were making progress on any of these issues, except for small towns, where most thought there was progress on race relations and infrastructure.
In every type of community the bulk of voters thought they were losing political influence in the state. On the question of how well-represented respondents were in state government, their answers varied based on community, but not by much.
Majorities in rural areas (55%) and suburbs (50%) said they were not well-represented in state government, while bare majorities in large cities (51%), small cities (50%) and towns (52%) said they were well-represented.
The loss of influence was especially felt in rural areas, where for every two voters who thought their community was gaining political influence, there were five who thought they were losing it.
It’s important to note that the sample size in these subgroups makes it difficult to make definitive conclusions, but the findings suggest that urban, suburban and rural voters are not so different when thinking about local issues. The differences were more in degree than in kind. That picture changes when philosophical issues are the focus and partisan attitudes take over.
The partisan divide
As is typical of odd-number years, party identification was lower in this survey than it is in election years. Some 46% said they would register as an Independent if party registration were required. Even so, twice as many said they would register as a Democrat (36%) as said Republican. The 18% who said they would register as Republicans ties the GOP low-water mark going back to 1992.
Aided by the low Republican identification numbers, there were more Democrats than Republicans in each type of community, from a 52% to 5% advantage in large cities to 30% to 27% edge in small towns. Geographically, the area containing Pierce and Kitsap counties was the only region where Republicans outnumbered Democrats (26% to 25%). Even in eastern Washington, there were 27% Democrats to 21% Republicans in this poll, with nearly half (48%) refusing to align with either party.
To probe political attitudes, we asked voters to choose a side on 13 political issues. Most respondents agreed with most of the statements, including that:
- Government controls too much or our daily lives.
- Slavery and the history of race relations should be taught in schools.
- Political correctness inhibits free speech.
- Climate change is a serious threat that requires significant govt action.
- Government is almost always wasteful and inefficient.
- The wealthy and large corporations are not paying their fair share of taxes.
- The economic system is generally unfair (mostly in favor of the rich).
Pluralities (more people than not) agreed that:
- It should be easier, not harder to vote.
- It should be harder, not easier to own a gun.
For only four of the 13 issues were there equivalent numbers on both sides. These most divisive issues were ones that have divided the country for decades and longer:
- Immigration: whether illegal immigration is a serious threat.
- Abortion: whether it should be easier or harder to get.
- Racial discrimination: whether it holds minorities back.
- Government assistance: whether it is more likely that needy people are going without it or that irresponsible people are getting help they don’t deserve.
We coded the answers as being on the political “left” or “right” side of each issue. Subtracting the “right leaning” answers from the “left leaning” answers gives each respondent a score on a scale from +13 (13 left-leaning answers) to -13 (13 right-leaning answers).
The conclusion from this measurement supports the conventional wisdom that Washington is a center-left state overall. The statewide average was +1.54 points to the left of center, with 6.2 “left-leaning” answers and 4.7 “right-leaning.”
Collapsing the index into categories results in the following:
- 14% Conservative (right-leaning positions on a majority of the issues).
- 22% Right Leaning (more right-leaning answers than left-leaning).
- 15% Center (1 more left than right to 1 more right than left answer).
- 21% Left Leaning (more left-leaning answers than right-leaning)
- 28% Liberal (left-leaning positions on a majority of the issues)
This index allows for a quick comparison across these categories of voter and indicates the political divides in the state. Here’s a surprise: the gulf is widest between Democrats and Republicans.
Democrats scored 8.48 to the left, with 74% categorized as liberal.
Republicans scored 5.97 to the right, with 56% categorized as conservative.
Independents are in between, but tilt slightly right (0.83 to the right), with 30% categorized as conservative vs. 18% liberal.
That a regional difference emerged in this scale will not surprise anyone who pays attention to Washington politics. Seattle, home to 10% of the state’s voters, is far more liberal than any other area, at +7.07, with 73% categorized as liberal on the index. Large cities overall are substantially less liberal than Seattle but far more liberal than other types of community. Eastern Washington is most conservative at -1.14, with 43% categorized as very conservative.
Left-leaning areas:
Seattle (+7.07)
Large cities (+4.46)
King County (+2.67)
North Sound (+2.17)
Small cities (+2.02)
Suburbs (+1.62)
Right-leaning areas
Eastern Washington (-1.41)
Rural areas (-0.61)
Small towns (-0.39)
Pierce/Kitsap (-0.05)
A closer look indicates that rural areas in general are not as conservative as their reputation implies. Suburban areas are closest to the center of the state’s political spectrum, which tantalizes the Republicans. But that center is trending left.
This analysis helps to explain recent voting patterns and the shifting political landscape in Washington state. It suggests that Washington is not as deep blue as the coloration on the electoral maps implies. Meanwhile, population growth — mostly in already populated areas — combined with the increasingly ideological parties, is improving the attitudinal terrain for Democrats. As “urban” attitudes take hold in the suburbs and beyond, the fertile ground for Republicans is shrinking.