The assumption of a “red wave” was created by a mixture of historical and political conditions: First, the president’s party almost always loses congressional seats in his first midterm election. Second, Biden’s approval ratings were underwater. Third, inflation is at a longtime high. And fourth, Democrats were defending more vulnerable seats than Republicans.
Feeding the expectations were the polls, which showed movement toward Republicans late in the campaign. Nationally, the polls actually had a good night. Most polls in the most contentious states said it was going to be close. And boy, was it.
Here in Washington, the polls told a different story. Our January poll hinted at a potential red wave, with party identification at 39% Democratic to 29% Republican — the closest it has been since 2017. Only 3% more voters said they intended to vote for Democrats than Republicans for the state Legislature. U.S. Sen. Patty Murray looked vulnerable, leading a generic “Republican to replace her” by just three points (42% to 39%).
But our July poll caught the “blue surge” following the Supreme Court decision to overturn Roe v. Wade. Party identification and the generic legislative race had both widened to a 20-point Democratic advantage. Murray led Republican challenger Tiffany Smiley by 20 points in the poll and went on to win the August primary by 21 points.
By September, the “blue surge” had ebbed. Murray’s lead had shrunk to 13 points, the Democrats’ generic legislative lead was down to seven points, and Democrats led party identification by 11 points. It was a return to normal in Washington, which for years has had a 10- to 12-point Democratic advantage.
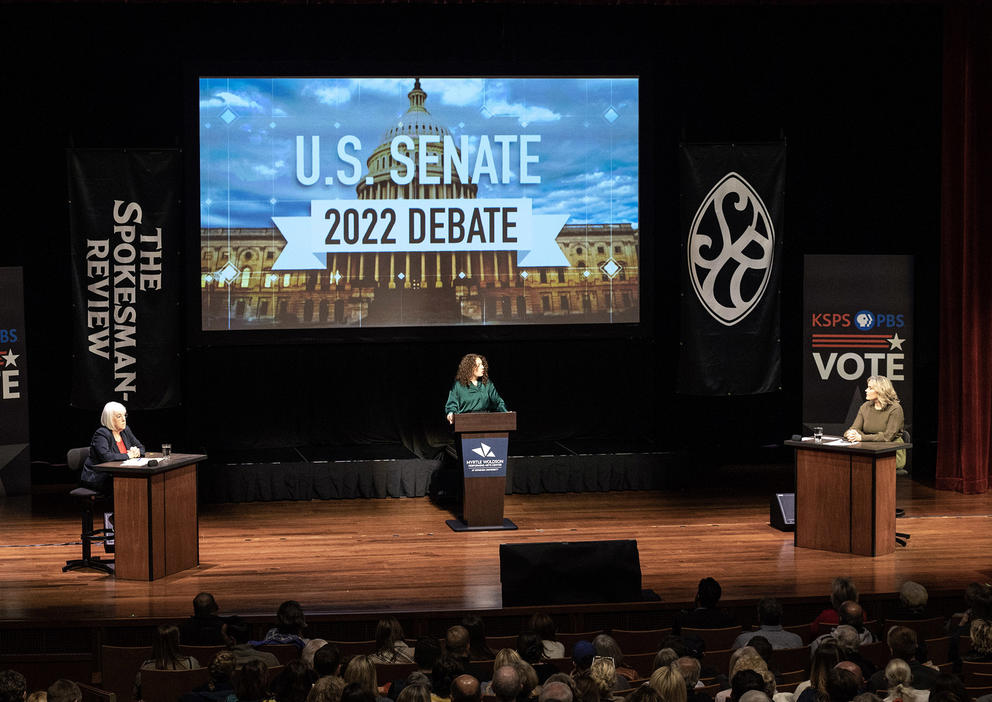
The Senate story then became an ever-tightening race, with Smiley matching Murray ad for ad and the challenger inching closer to the incumbent in the polls. That was a mirage. In the end, Murray won 57% to 43%. Smiley earned the same vote percentage that Republican gubernatorial candidate Loren Culp had two years ago against Gov. Jay Inslee, carrying one less county than Culp (Whitman).
So why had the Murray/Smiley race ever seemed close? It was the polls. After the August primary, 19 surveys were published on the Murray/Smiley race. Of those, 10 were conducted by Republican-affiliated firms, four by Democratic-leaning firms and five were media-sponsored polls.
The average of the Republican polls had Murray leading by three points (48%-45%). The average of the non-Republican polls was a 10-point Murray lead (51%-41%). The public and Democratic-leaning poll averages were the same. None of the 10 Republican polls ever had Murray above 49% nor Smiley under 42%. Only one non-Republican poll had Murray under 50%, and only one had Smiley above 42%. Our last Crosscut/Elway Poll had Murray leading by 12 points (50% to 38%) in September.
The large number of Republican-leaning polls was new this year. They affected the polling averages and changed the story being told about the Senate race, which was never as close as the polling averages made it seem. Murray’s 14-point win should not have been a surprise.
Some people are probably wondering how this can happen. It seems unlikely that partisan pollsters would deliberately skew their results. Even if they wanted to cater to their sponsors, they want to stay in business, which you won’t if you produce unreliable results. An answer lies in the methods of polling. Survey research is often called (mainly by pollsters) “an art and a science.” It is more art than science. It boils down to whom you ask and what you ask.
“Whom you ask” is the sampling design. In election polling, pollsters must estimate who are likely voters and make sure to interview a representative sample of them. Estimating likely voters is essentially educated guesswork, and every pollster has their own formula. Republican pollsters may have missed on two crucial categories: age and party identification.
Young voters apparently turned out in higher proportions this year than in previous elections and voted heavily for Democrats, wreaking havoc with many likely voter models and causing those polls to underestimate the Democratic vote.
Having the right proportion of Republicans, Democrats and Independents is critical to a reliable poll. How do you do that in Washington, where there is no party registration? By overestimating the number of Republicans and weighing samples accordingly, pollsters could have overrepresented Republican strength and underestimated Democratic strength this year.
Further, in the Senate race, Independents and undecided voters apparently broke strongly for the incumbent, counter to the typical pattern of late deciders, who most often vote for the challenger.
“What you ask” is also an obvious factor in poll results. In our September poll, Republicans and Democrats named different sets of issues when asked what factors were influencing their vote. Republicans named the economy, crime and taxes as their top issues. For Democrats, it was abortion, climate, the economy and the political system.
What you don’t ask may be just as important. Survey respondents can answer only the questions they are asked.
After the “blue surge” appeared to have stalled, conventional wisdom held that the impact of the Supreme Court’s abortion ruling had faded in influence as voters returned to concerns about the economy. In national exit polls, nearly half of respondents named inflation when asked to choose the most important issue facing the country. No other issue was above 10%.
But lo and behold, abortion (27%) was right behind inflation (31%) as the top issue on which people based their vote. No other issue was even close. The economy may be the most important issue facing the country, but abortion rights were near the top of what people were voting about in this election. The abortion issue had not gone away; it was just not asked about in the right way.
“Protecting democracy” did not show up in public national polls or exit polls because it wasn’t asked. It did show up as a top issue in the AP Votecast poll published after the election, where 44% named “the future of democracy” as their primary voting consideration.
It turns out that the Democrats were campaigning on issues more pertinent to voters. Abortion and democracy flipped the elections from being a referendum on Biden to a choice between Democrats and Republicans. Yes, voters were worried about inflation, but it did not drive the final choices of crucial swing voters.
The results should not have been that surprising, but it is difficult to break out of the “expectations” bubble to hear what voters are really saying.